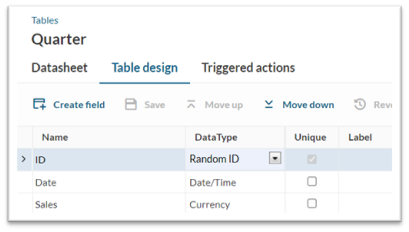
Before you begin: Ensure that you have a table that stores individual sales with a date in each record.
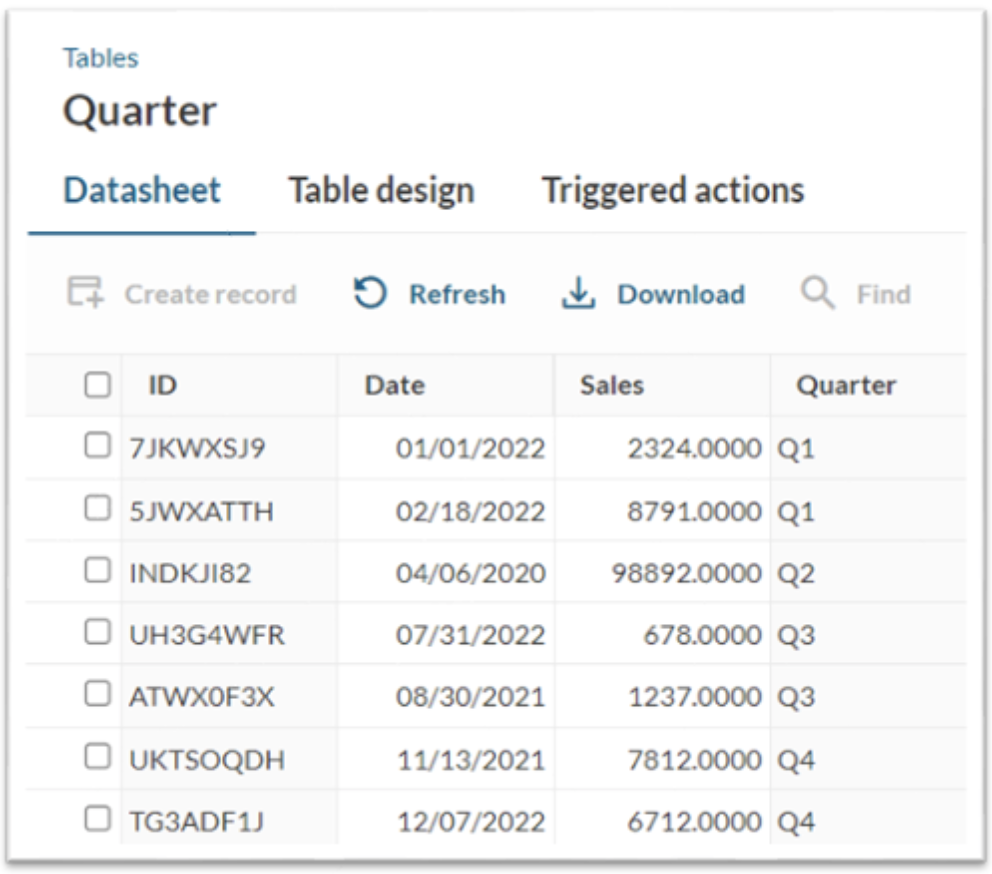
Sample table design:
Steps:
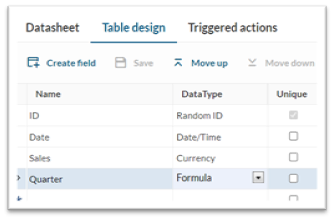
- In Tables, go to Design of your table. Add a new field of Formula data type. In the right panel, edit the formula and paste the following text:
- In the pasted formula, replace [@field:Date] with your actual date field.
- Name this formula field as Quarter and save.

- In your table’s Datasheet tab, verify that the Quarter field automatically generates the corresponding quarter signature based on the date field.
- In DataPages, click Create DataPage. Under Charts, select a Pie Chart.
- Select your table as the data source.
- On the Search Type screen, make sure that the Show Search Form radio button is selected.
- On the Select Search Fields screen, move the Date field to the selected fields on the right.
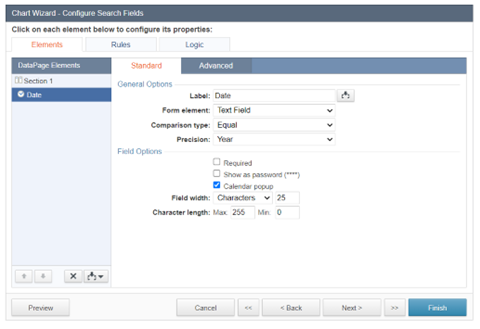
- Proceed to the Configure Search Fields section. Select the Date field and change the Precision to Year.
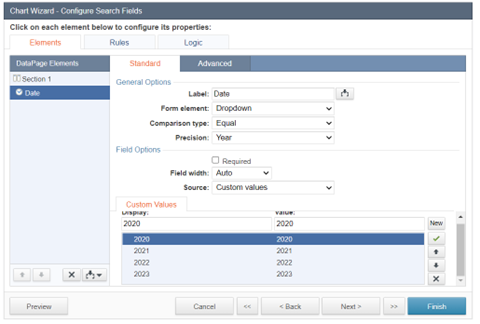
- In the Form Element dropdown, make one of the following choices:
- If you want the users to manually type in the year they want to see, select Text Field.
- If you want to predefine the years for users to choose from, select Dropdown and add relevant fields as custom values.
Text field:
Dropdown:
- On the Configure Chart Options screen, click Category and select the Quarter formula field as the category field.
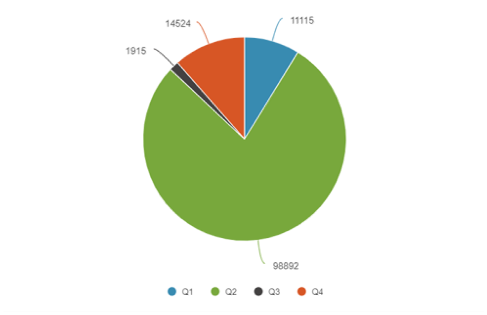
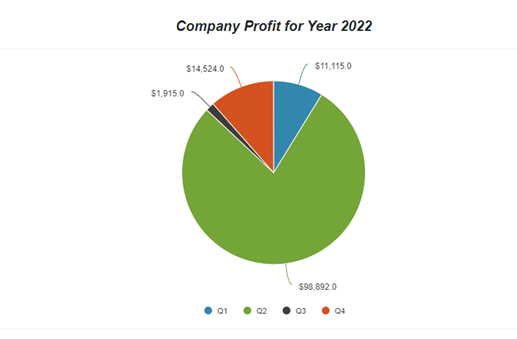
- Click Value and configure the value to show your data.
Example: Sum of sales per quarter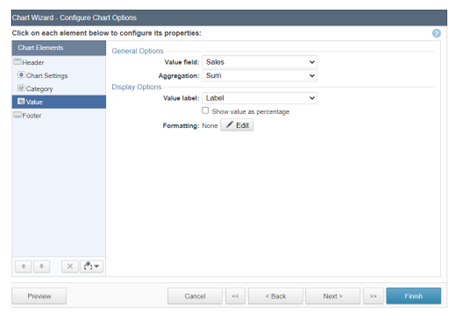
- On the Chart Page Options screen, from the Chart sort order dropdown, select Category(Quarter).
- Click Finish.