Pivot Table Reports
4 minutes to readPivot tables are used for summarizing data. They can automatically process large amounts of data and generate a report showing count totals, averages, sums, and other calculations, as well as arranging data into groups. Pivot tables provide insight that may otherwise be difficult to see.
For example, below is a table of sales information in its original format. It lists products sold by sales representatives. However, it is hard to compare how each sales representative is performing or identify which product generates the most revenue. These questions can be easily answered using a pivot table report.

Creating a summary table that sums key amounts (such as total sales of a specific product or sales representative) helps you to look for trends and patterns in the data. You can apply calculations, create multiple groups, expand/collapse groups, and show values as percentage of totals, rows, or columns.
Watch Video Tutorial
Creating Pivot Tables
Creating a pivot table DataPage begins like any other Report DataPage. You can configure a search form or pre-defined criteria for your report. The configuration of the pivot table itself consists of configuring the following areas.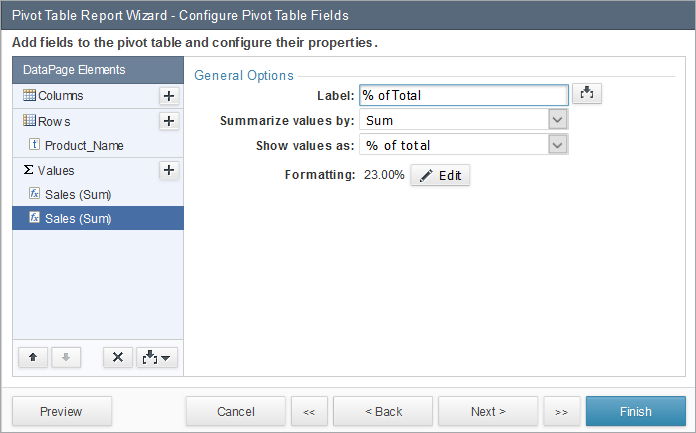
- Columns – The distinct values of the fields added to this section become the columns of your report. For example, if you insert the ‘Product’ field into this section, a distinct list of all the products from your table will be presented as columns of the report. Adding more than one field here results in groups and subgroups in the columns of your report. For example, if you add the ‘Country’ field first, followed by ‘Product’ below it, your report will show products grouped by countries.
- Rows –This section works exactly the same as columns but for rows. For example, you can insert the ‘Sales Person’ field in this section so the distinct list of your sales people will show as the rows of the report.
- Values –Values are at the cross-section of rows and columns. For example, if you want to show revenue by product from each sales person, insert ‘Revenue’ to this section and select the ‘Sum’ function. If you also want to know the maximum transaction size by sales person per product, insert the same ‘Revenue’ field again and this time select the ‘Max’ function.
Drilldown Pivot Tables
The pivot drilldown option adds functionality that lets app users view the data behind each summary value. When enabled, app users can mouse over any value on the pivot report and click to see the underlying data that comprises the value. The data is displayed (and configured) just like any other Caspio results set report, such as in Search and Reports DataPages.
To enable pivot drilldown, open your Pivot Report in the DataPage wizard and complete the following steps on the Configure Pivot Table Options screen.
- Under Drilldown Options, select the Enable drilldown reports Click Next.
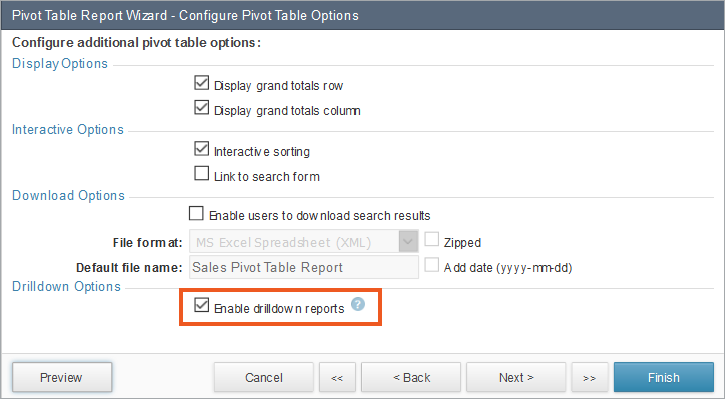
- The remaining steps to configure the results page screen are similar to Search and report DataPages. You can enable the details page, allow data editing, generate emails, etc.
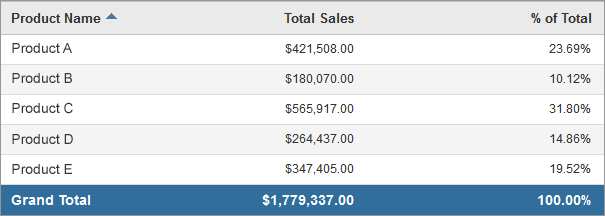
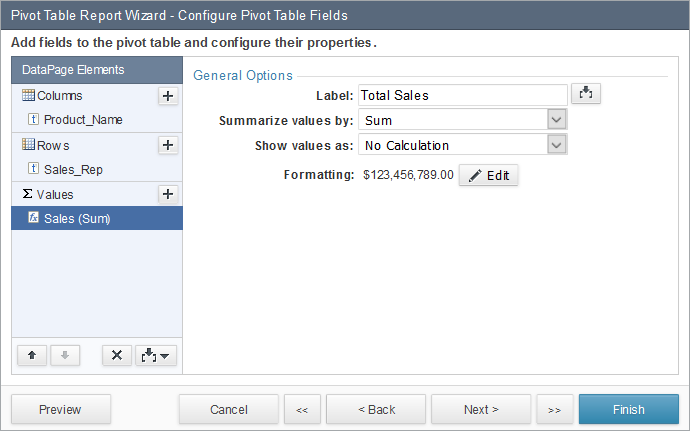
Example 1: Simple Summary Report
This is an example of a pivot table for a simple summary report of the total sales for each product.| Element | Configuration |
| Columns | None |
| Rows | Product Name |
| Values | Sales; Summarize values by ‘Sum’ Sales; Summarize values by ‘Sum’; Show values as ‘% of Total’ |
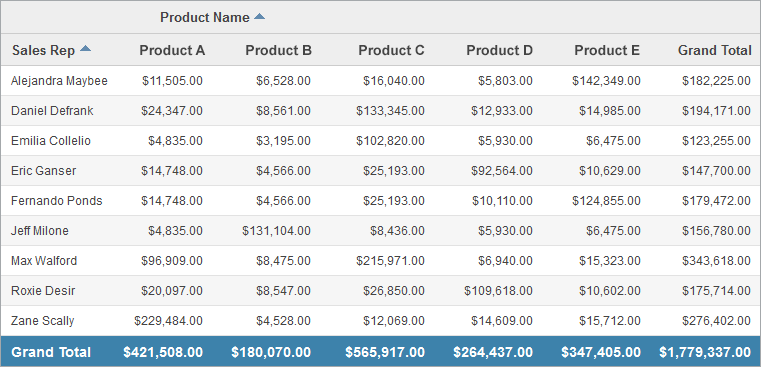
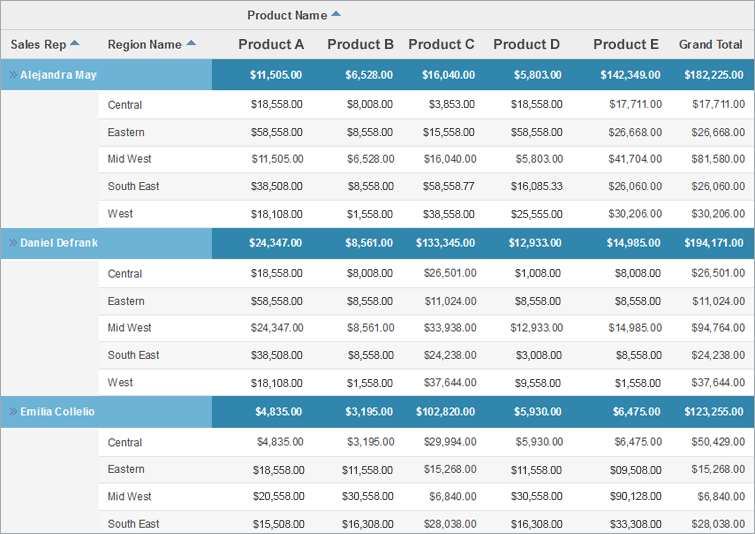
Example 2: Complex Summary Report
This report compares total sales of sales representatives by product.| Element | Configuration |
| Columns | Product |
| Rows | Sales Rep |
| Values | Sales; Summarize values by ‘Sum’ |
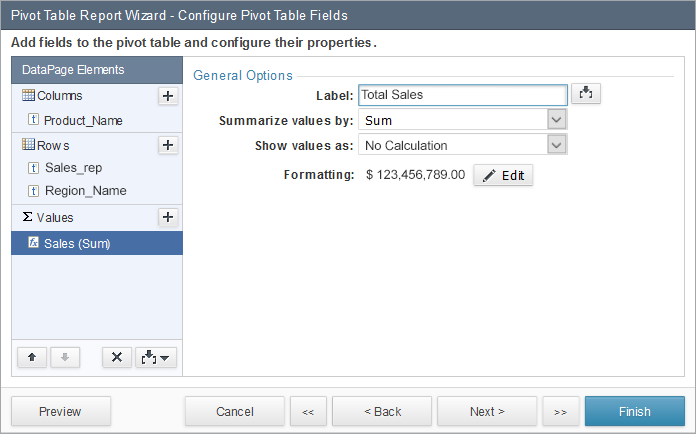
Example 3: Summary Report with Grouping
This example shows how you can create a more complex report that compares numbers across multiple dimensions. In this case, revenue generated by each sales person are shown by product in various regions.| Element | Configuration |
| Columns | Product |
| Rows | Sales Rep Region |
| Values | Sales; Summarize values by ‘Sum’ |
Grouping settings become available for rows or columns when the respective section has more than one field. Grouping is not available for the last field in each section.
For more details, you can watch the recording of our live session: