Integrations Logs
3 minutes to readIntegrations logs are collective logs for outgoing webhooks and requests sent by extensions.
The logs for outgoing webhooks allow you to monitor the history of activities related to messages that Caspio sends to external services. Currently, you can view logs for the following activities:
- Message created – A webhook message was created based on an event specified in the webhook definition.
- Message sent – A webhook message that was previously created was sent to an external service or services.
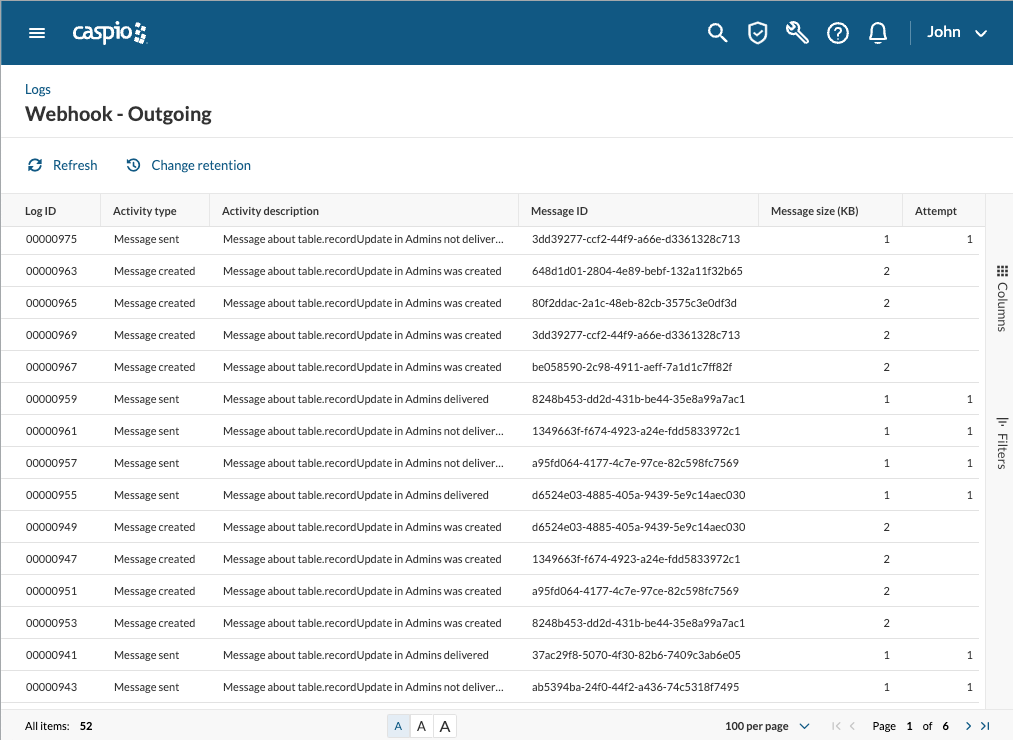
The logs for outgoing webhooks contain the following information:
- Log ID – Unique ID of a log entry.
- Date – Date and time in the local time zone that can be configured in the account settings.
- Activity type – Category of activity for which a log entry was created.
- Activity description – Summary of an activity.
- Message ID – Unique ID of a webhook message.
- Message size (KB) – Size of a webhook message that was created and sent.
- Attempt – Consecutive number of times the system tried to deliver a webhook message.
- Event date (UTC) – Date and time of a webhook event in UTC format.
- Status – Status of an activity, that is Success or Failure.
- HTTP code – Numeric code that the target service sends as a response to a webhook call to indicate the outcome.
- HTTP response – Message from the target service that describes the outcome of a webhook call.
- Status details – Description of an activity status.
- Webhook ID – Unique identifier of a webhook definition in which an activity occurred.
- Webhook name:
- Outgoing webhooks: Webhook definition label in which an activity occurred.
- Extensions: Installation ID of a given extension.
- Webhook URL – Target service URL.
- Event ID – Unique identifier of an event definition.
- Event type – Activity in the source object that triggered a message, that is, table.recordInsert, table.recordDelete, or table.recordUpdate.
- Object type – Type of system object where an activity occurred.
- Object name – Name of the table where an activity occurred.
- Object fields – For all event types, an empty value indicates that all table fields are monitored for changes. For table.recordUpdate events, contains a list of fields that are monitored.
Some columns are not visible in the default logs view. You can choose what data you want to display in the Columns pane on the right.
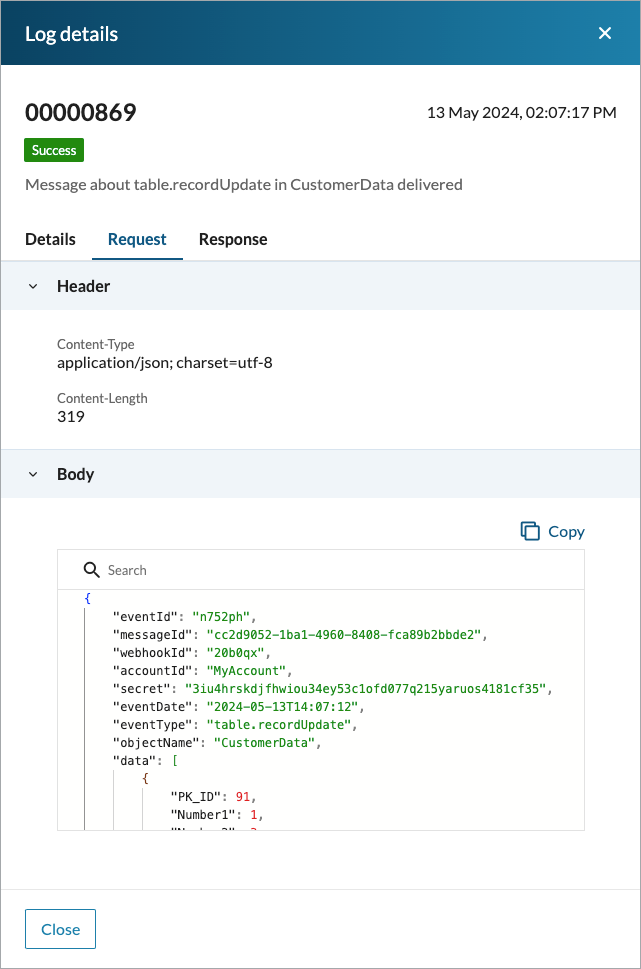
To view all the details of a webhook message, including the request and response content, hover over a row and click the Details button. You can view the details of different logs without closing the panel.
Note: For security reasons, the request and response content is not visible in logs for HIPAA/Compliance accounts.