DataPage Types
5 minutes to readDataPage types fall into the following high level categories:
Forms
You can create a form to capture, update, or allow your authenticated users to recover their passwords by email. A Web Form is a DataPage that captures data, such as text, numbers, files, and images, into your database. Three types of web forms are available:
- Submission Form – Allow users to submit records into your table.
- Update Form – Use to display and edit existing information in the database.
- Password Recovery DataPage – Allow authenticated users to retrieve their passwords via link in an email. You can embed password reset pages and configure a password recovery email.
You can also configure forms to include the following:
- Generate automatic acknowledgement and notification emails
- Receive and pass parameters to facilitate data input
- Use Authentication, Connection, or Record Level Security
- Configure DataPages to be a part of multi-page applications that use all relational databases capabilities
You can create surveys, contact-us forms, and registration forms using a Web Form.
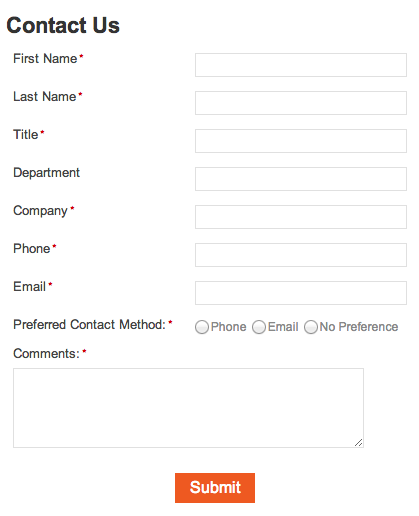
Example of Submission Form
Reports
A Report displays your data in a variety of ways and it can be configured to become multi-page, feature-rich DataPages. Five types of Report DataPages are available:
- Tabular – Search results are displayed in a table.
- Gallery – Search results are displayed in a grid of multiple rows and columns.
- List – Search results are shown in a vertical list, one record after the other.
- Details – Skips the results page and go directly to the Details page of the first matching record. This option is ideal when you are certain there is only one record matching the search criteria.
- Combined Chart and Report – Search results are displayed in a table and in a chart simultaneously.
You can include a search, result, and details pages in a Report DataPage.
- Search – An interactive or pre-defined search query for data filtering.
- Results – A results screen where matching records are displayed in a tabular format. It may be configured to allow adding, editing, or deleting data. An optional automatic paging mechanism is available in this view for large tables.
- Details – A detailed view of a selected record from the results page.
You can also generate automatic notification and acknowledgement emails if you allow end users to modify data on your Report DataPage. You can create customer management systems, issue tracking systems, product inventory systems and knowledge base systems using a Report.
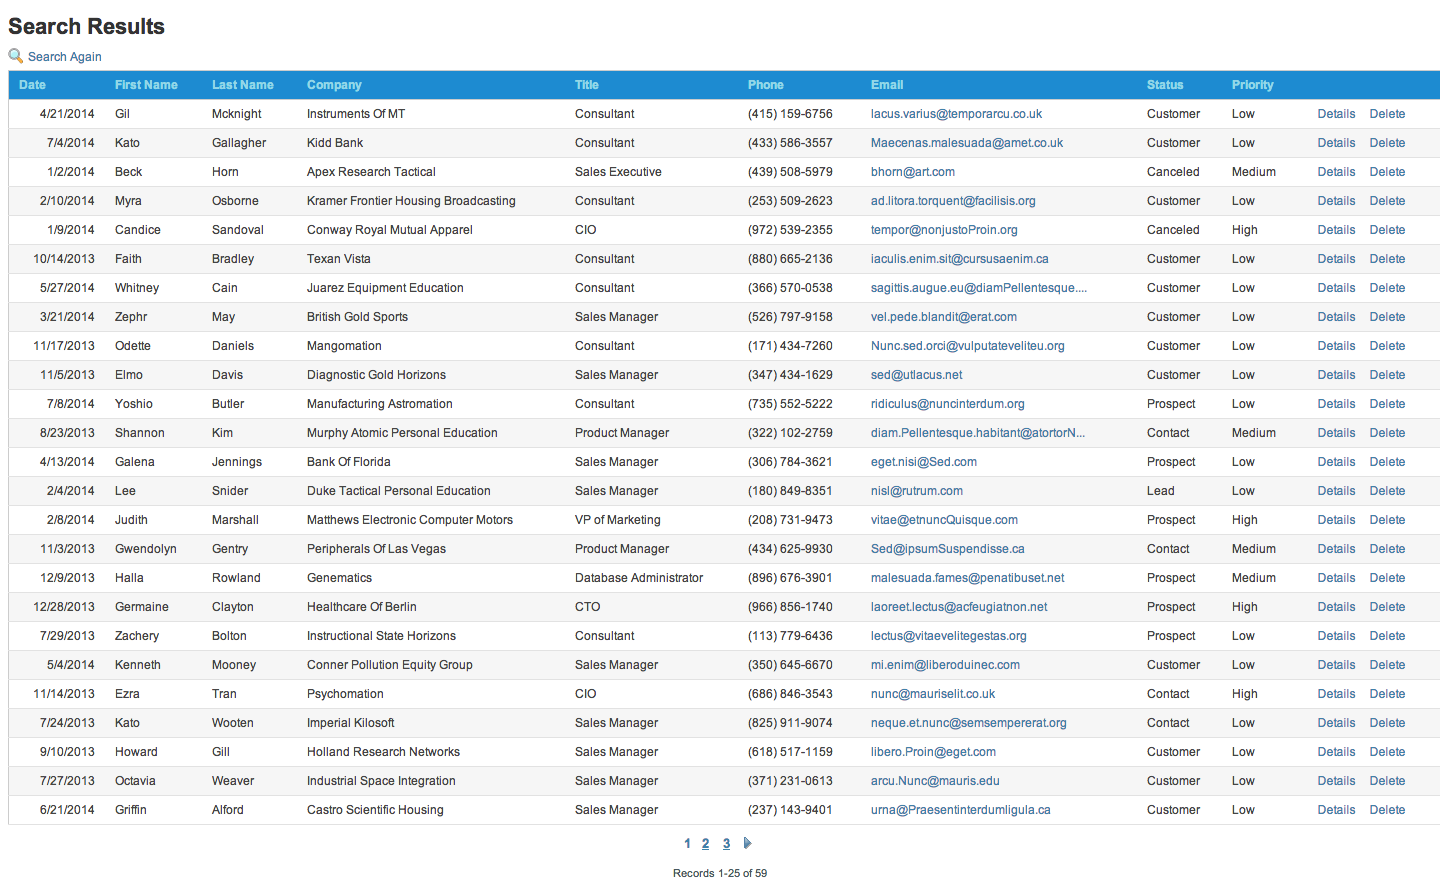
Example of Tabular report
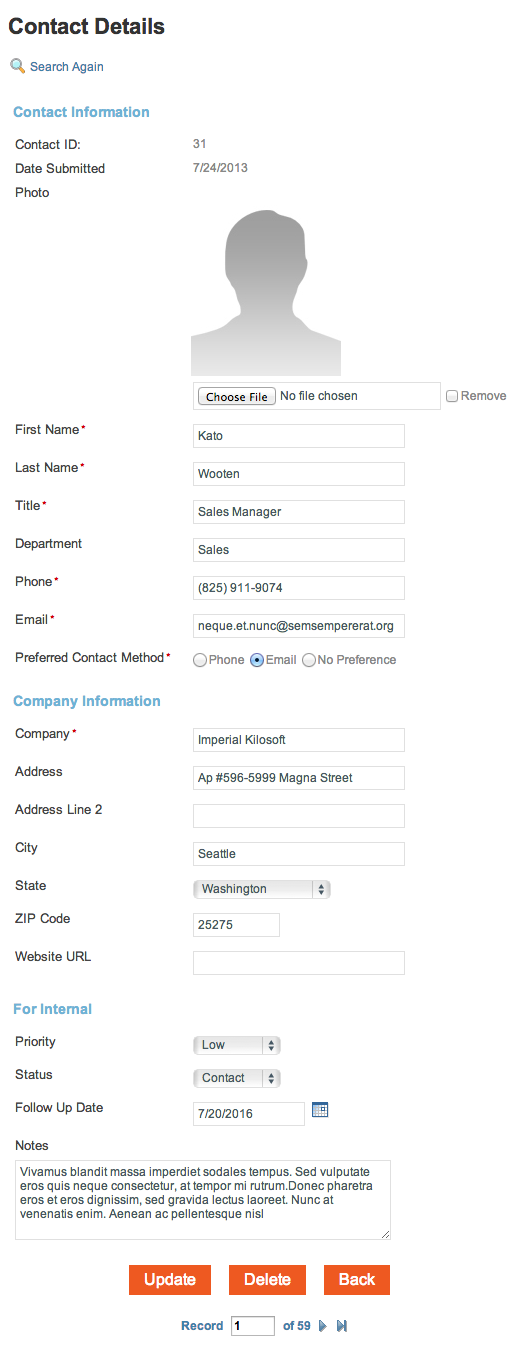
Example of Details Page
Calendars
A Calendar displays your information in monthly or weekly layouts. It has similar functionalities and capabilities as a Report DataPage, where it can be configured to become multi-page applications. Two types of Calendar DataPages are available:
- Weekly – Display your data in a weekly format.
- Monthly – Display your data in a monthly format.
Similar to Report DataPages, you can configure a Calendar DataPage to include the following:
- An interactive search form or pre-defined criteria
- A results page where matching records are displayed in a calendar format
- A details page where one record is displayed and some or all fields may be editable
You can create calendars for event directories, including seminars and meetings, and provide links to a details page that display additional Information for a particular event.
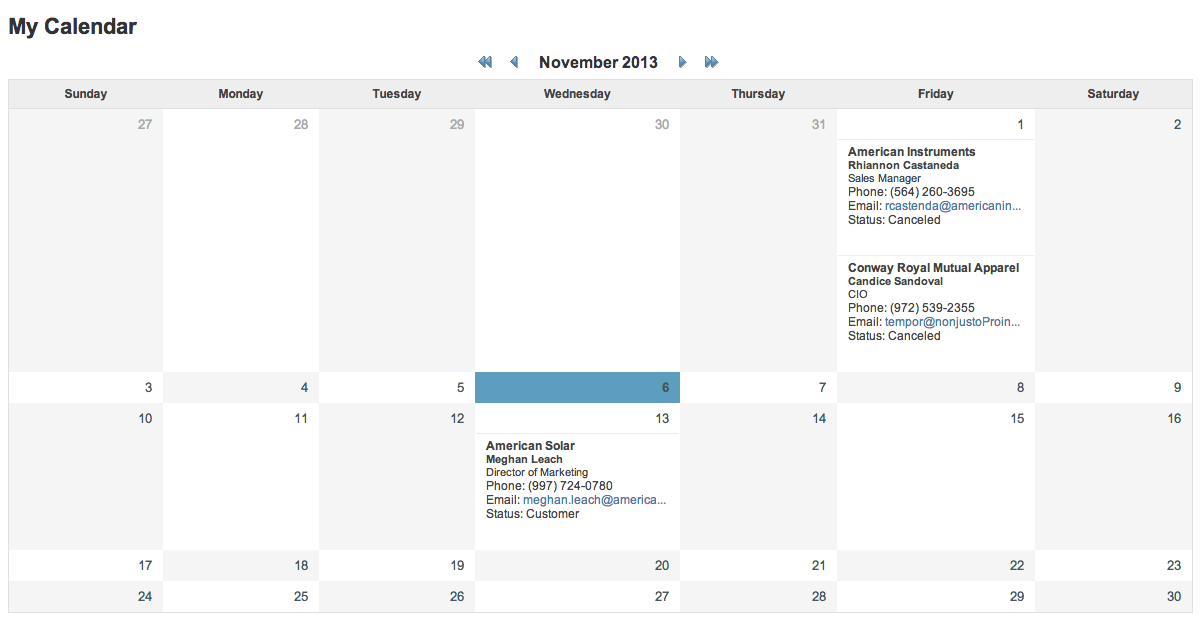
Example of a Calendar DataPage
Charts
A Chart presents your data in visual, graphical form. It has similar functionalities and capabilities as a Report DataPage. Six types of charts are available:
- 2D Bar – Search results display in a bar chart.
- 2D Column – Search results display in a column graph.
- 2D Pie – Search results display as slices of pie.
- Line – Search results display series of data points connected by straight segments. This is ideal for showing trends over time.
- Step – Search results display a series of data points connected only by vertical and horizontal links. This is ideal for showing a procedure or a change in value over time.
- Spline – Search results display a series of data points with a fitted curve. This is ideal for graphing limited number of data points and estimating intervening values.
You can configure a Chart DataPage to include the following:
- An interactive or pre-defined search query for data filtering
- A results page where matching records are display in a chart format
You can graph statistical data, demographics, salary information using charts.
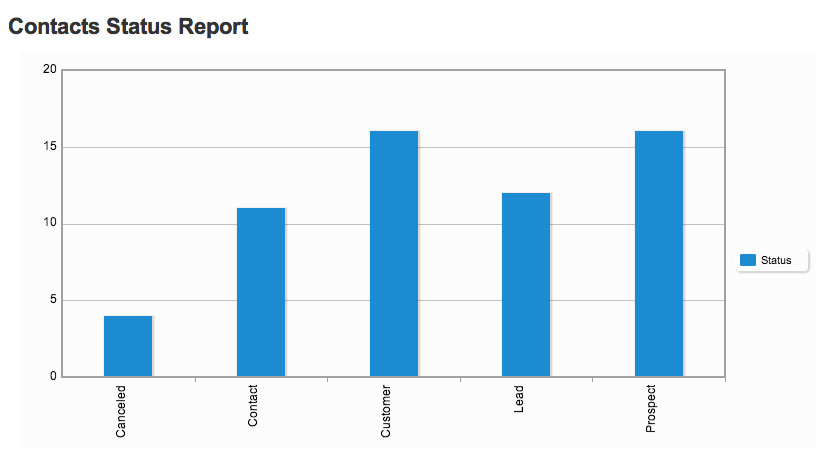
Example of a Chart DataPage
HTML Page
An HTML DataPage allows you to create a simple web page using your own HTML source code. It is useful when you need to password protect HTML content or have users log into a homepage or navigational page instead of a DataPage. This is also ideal for displaying messages, such as “Submission successful” or “Update Received” after a Submission Form has been submitted.
You can configure an HTML DataPage with the following:
- Password protection using Web User Authentication
- Link to externally hosted images or resources
You can create a basic menu system or open a new screen to your application with an HTML DataPage.

