Do you need to plot the geographic location of multiple records? Integrating Google maps directly into your apps is easy. This article takes you through the process of adding a map mashup to your DataPages.

Steps to add map mashup to a Report DataPage:

  1. Create a new table or edit an existing table in your account to add the following fields. These fields will be used to plot markers in the Google map in the later steps.
    • Address              [Text255]
    • City                     [Text255]
    • State                   [Text255]
    • Zip                      [Text255]
    If the addresses are geocoded, add the following fields in the table to store latitude and longitude data. It is recommended to geocode your data if you have a large data set for performance improvement.
    • Latitude              [Number]
    • Longitude           [Number]
  1. You can add the field below the display a record information on a map marker if needed.
    • Description        [Text255]
  1. Create a Report DataPage with the table above as the data source.
  2. In the Datapage wizard, insert an HTML Block at the bottom of DataPage elements in the "Configure Results Page Fields".
  3. Disable the HTML editor, copy and paste the following code in the HTML block.
    Use this code if the data is geocoded:

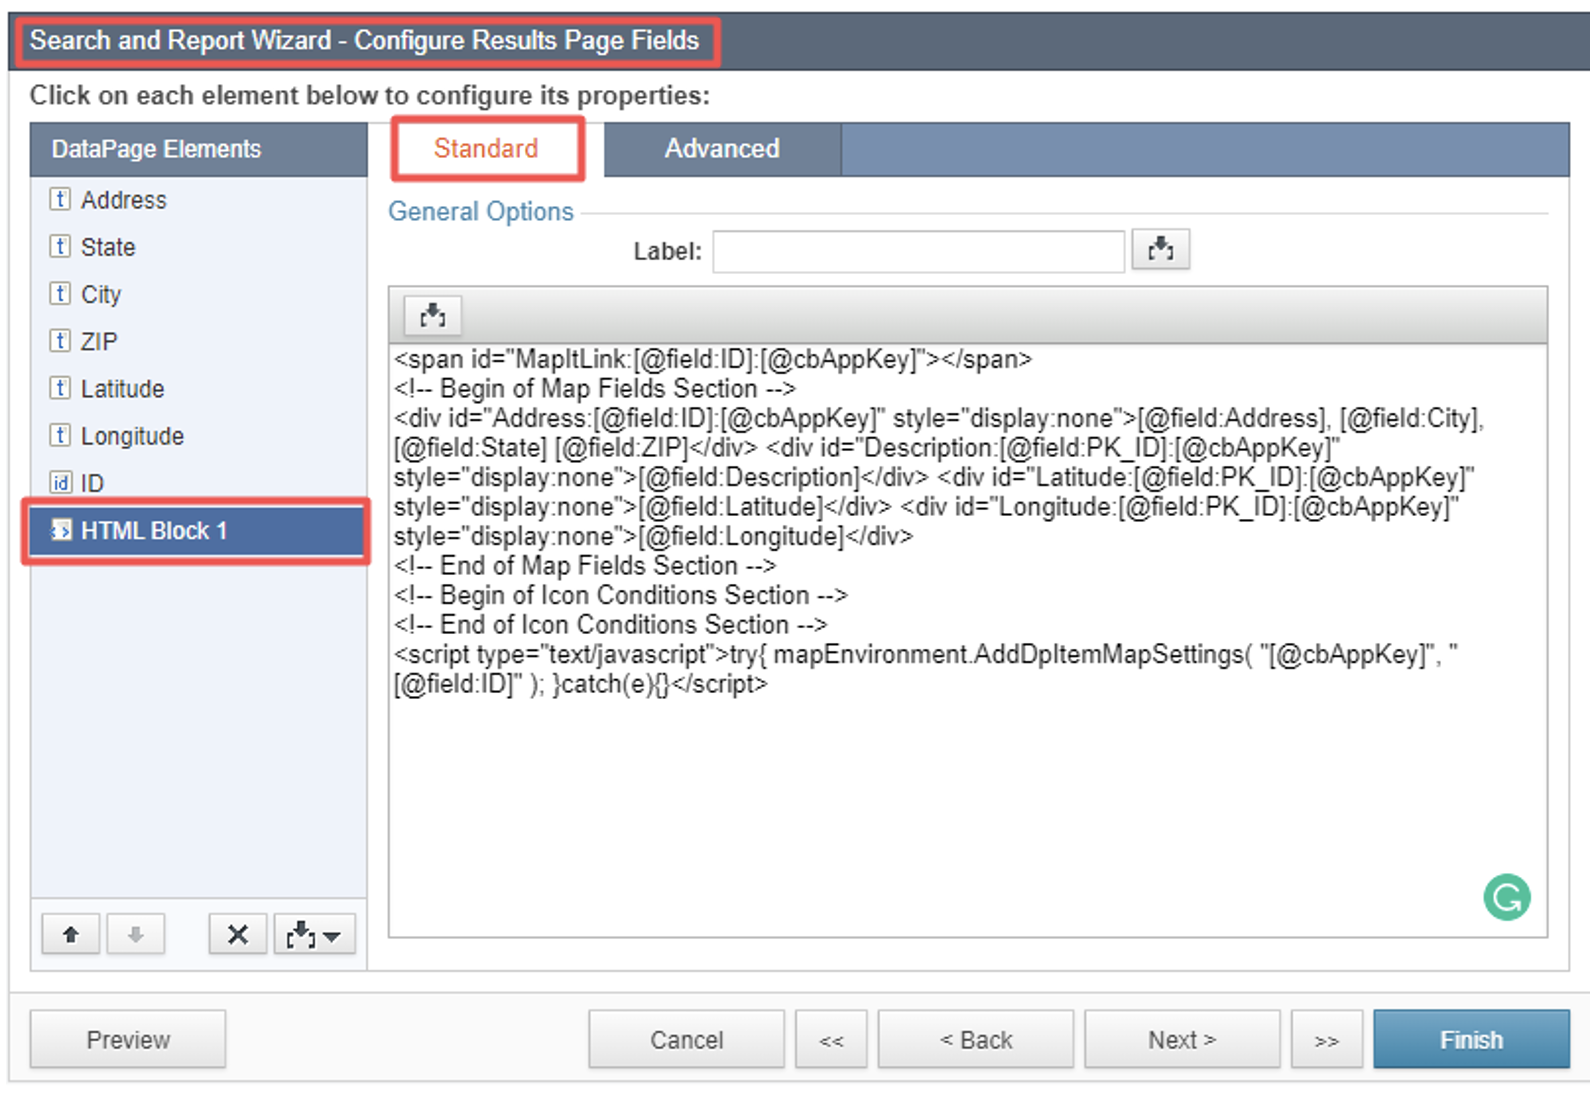
    Use this code if the data is NOT geocoded.

Notes:

    If you have the address, latitude, longitude and description fields with different names, update fields’ name with the corresponding names in the code.
    If you don’t have the description field, the address will be used as the description.
  1. Skip this step if the Details page is not enabled.
    • To display the map in the Details page, in the "Configure Details Page Fields" wizard screen, insert an HTML Block at the bottom of the DataPage elements. Disable the HTML editor, copy and paste the following code into the HTML block.
    Use this code if data is geocoded:
    Use this code if the data is NOT geocoded:
    • To hide the map in the Details page, insert Header/Footer in the DataPage elements. Disable the HTML editor in the Header, copy and paste the following code into the Header.
  1. Save the Report DataPage.
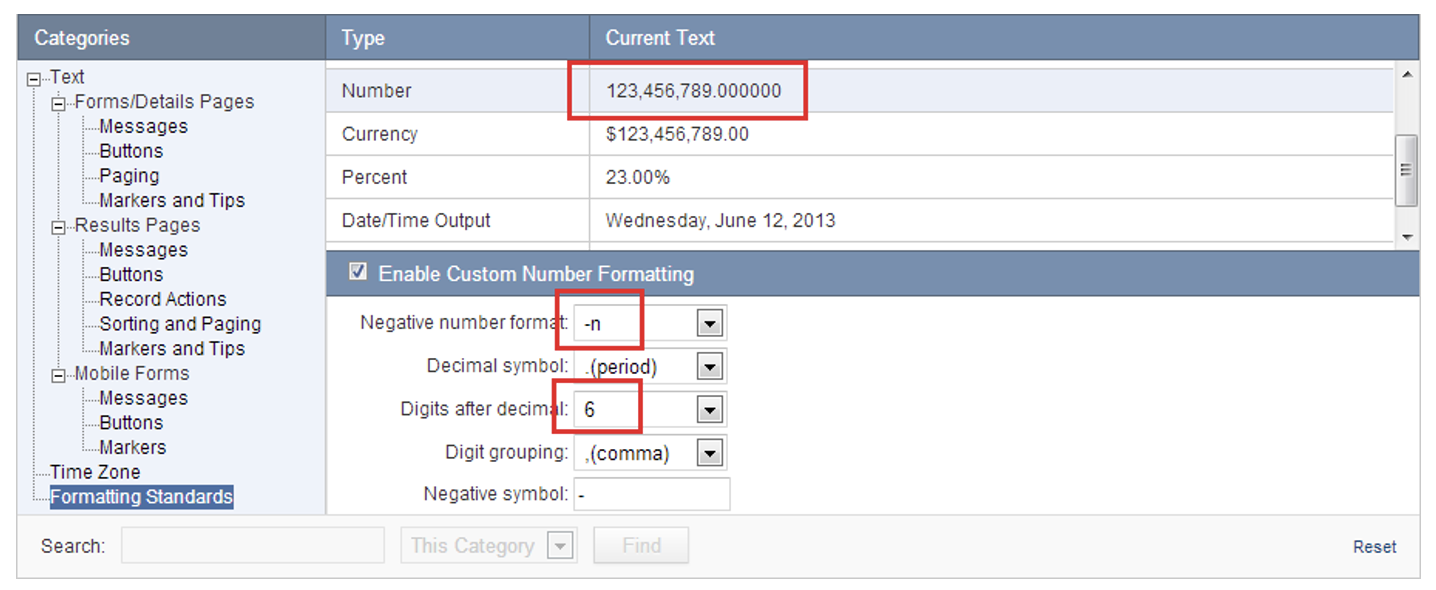
  2. Skip this step if the data is not geocoded. Edit the Localization object used in the Report DataPage to set the number format as shown in the image below.
  3. Copy and paste the following code into a web page where you deploy the Report DataPage.
  4. In the code above:
    • Replace YOUR_DP_APPKEY with the AppKey of the Report DataPage.
    • Replace YOUR_GOOGLE_MAP_API_KEY with an actual Google map API key value. Follow this process to get Google Maps API Key.
    • The code has some variables that can be customized to your needs. Learn more.
  1. Copy and paste the Report DataPage deployment code below the custom code from step 8.

Map Settings

Parameter Description Allowed values
mapType Defines which map API to use. Only Google maps are supported in this version. ‘G’ or ‘GOOGLE’
mapView Defines the default map view (Road, Satellite, Hybrid, Terrain). 'R', 'ROAD', 'ROADMAP' for single road map 'S', 'SAT', 'SATELLITE' for satellite map 'H', 'HYB', 'HYBRID' for hybrid (road + satellite) map 'T', 'TERR', 'TERRAIN' for terrain map
mapWidth Map Container’s width in pixels Integer > 0
mapHeight Map Container’s height in pixels Integer > 0
mapCssStyle Map Container’s CSS style. Use it if you want to set specific style for container. The URL for the Cascading Style Sheet
useAutoZoom Defines whether the map should automatically adjust zoom level to location ‘Y’ or ‘N’
zoomLevelResult Zoom level for Results Page ‘1’ – ‘16’
zoomLevelDetails Zoom level for Details Page 1’ – ‘16’
zoomLevelMapI Zoom level for Map It functionality 1’ – ‘16’
bubbleOpenType Defines the event that will open InfoWindow with description on marker ‘0’ for no InfoWindow ‘1’ for mouseover ‘2’ for mouse click
disableScrollWheel Shows whether map zooming should react on mouse wheel ‘Y’ or ‘N’
showTrafficLayer Shows whether traffic and accidents will be shown on map ‘Y’ or ‘N’td>
plotMarkers Shows whether markers should be plotted right after DP is loaded. Not applicable to Details & Direct to Details pages. ‘Y’ or ‘N’
homePosition The default map position N/A
apiKey Paste your Google Maps API Key Follow this process to get Google Maps API Key: N/A

DataPage Settings

Parameter Description Default value
DefaultIcon Defines the default marker icon ‘1’ – ‘10’ or custom URL
DefaultIconWidth Defines the default marker icon width in pixels Integer > 0
DefaultIconHeight Defines the default marker icon width in pixels Integer > 0
MapItEnabled Defines if “Map It” functionality is enabled ‘Y’ or ‘N’
MapItLabel “Map It” link label Any custom text
FilterNeed Defines whether filtering should be applied to markers (only if you have icon criteria configured, see Customizations section) ‘Y’ or ‘N’
FilterRowSize Defines the number of filter items in a row Integer. Default is ‘5’
code1
<span id="MapItLink:[@field:PK_ID]:[@cbAppKey]"></span>
<!-- Begin of Map Fields Section -->
<div id="Address:[@field:PK_ID]:[@cbAppKey]" style="display:none">[@field:Address], [@field:City], [@field:State] [@field:Zip]</div>
<div id="Description:[@field:PK_ID]:[@cbAppKey]" style="display:none">[@field:Description]</div>
<div id="Latitude:[@field:PK_ID]:[@cbAppKey]" style="display:none">[@field:Latitude]</div>
<div id="Longitude:[@field:PK_ID]:[@cbAppKey]" style="display:none">[@field:Longitude]</div>
<!-- End of Map Fields Section -->
<!-- Begin of Icon Conditions Section -->
<!-- End of Icon Conditions Section -->
<script type="text/javascript">try{ mapEnvironment.AddDpItemMapSettings( "[@cbAppKey]", "[@field:PK_ID]" );
}catch(e){}</script>
code2
<span id="MapItLink:[@field:PK_ID]:[@cbAppKey]"></span>
<!-- Begin of Map Fields Section -->
<div id="Address:[@field:PK_ID]:[@cbAppKey]" style="display:none">[@field:Address], [@field:City], [@field:State] [@field:Zip]</div>
<div id="Description:[@field:PK_ID]:[@cbAppKey]" style="display:none">[@field:Description]</div>
<!-- End of Map Fields Section -->
<!-- Begin of Icon Conditions Section -->
<!-- End of Icon Conditions Section -->
<script type="text/javascript">try{ mapEnvironment.AddDpItemMapSettings( "[@cbAppKey]", "[@field:PK_ID]" );
}catch(e){}</script>
code3
<!-- Begin of Map Fields Section -->
<div id="Address:[@field:PK_ID]:[@cbAppKey]" style="display:none">[@field:Address], [@field:City], [@field:State] [@field:Zip]</div>
<div id="Description:[@field:PK_ID]:[@cbAppKey]" style="display:none">[@field:Description]</div>
<div id="Latitude:[@field:PK_ID]:[@cbAppKey]" style="display:none">[@field:Latitude]</div>
<div id="Longitude:[@field:PK_ID]:[@cbAppKey]" style="display:none">[@field:Longitude]</div>
<!-- End of Map Fields Section -->
<!-- Begin of Icon Conditions Section -->
<!-- End of Icon Conditions Section -->
<script type="text/javascript">try{ mapEnvironment. SetDetailsMapSettings( "[@cbAppKey]", "[@field:PK_ID]" );
}catch(e){}</script>
code4
<!-- Begin of Map Fields Section -->
<div id="Address:[@field:PK_ID]:[@cbAppKey]" style="display:none">[@field:Address], [@field:City], [@field:State] [@field:Zip]</div>
<div id="Description:[@field:PK_ID]:[@cbAppKey]" style="display:none">[@field:Description]</div>
<!-- End of Map Fields Section -->
<!-- Begin of Icon Conditions Section -->
<!-- End of Icon Conditions Section -->
<script type="text/javascript">try{ mapEnvironment. SetDetailsMapSettings( "[@cbAppKey]", "[@field:PK_ID]" );
}catch(e){}</script>
code5
<script type="text/javascript">mapSettings.hideOnDetails='Y';</script>
code6
<script type="text/javascript" src="//d23b32zmhbr2ct.cloudfront.net/mashup/script/caspio_mashups_v7.js"></script>
<!--/* Begin of Map Settings Section */-->
<script type="text/javascript">
var mapSettings = {
       "mapType": "Y",
               "mapView": "R",
               "mapWidth": "800",
               "mapHeight": "400",
               "mapCssStyle": "",
               "useAutoZoom": "Y", 
               "zoomLevelResult": "10",
               "zoomLevelDetails": "6",
               "zoomLevelMapIt": "13",
              "bubbleOpenType": "2", 
               "disableScrollWheel": "N", 
               "showTrafficLayer": "N", 
              "plotMarkers": "Y",
              "homePosition": "San Francisco, CA, USA",
                                                                                                                                                                                                       "apiKey": "YOUR_GOOGLE_MAP_API_KEY"
};
/* End of Map Settings Section */
/*** DATAPAGE SETTINGS ***/
var dpSettings = new mapDataPageSettings('YOUR_DP_APPKEY');
/* Begin of DataPage Settings Section */ 
dpSettings.DefaultIcon = ""; 
dpSettings.DefaultIconWidth = ""; 
dpSettings.DefaultIconHeight = ""; 
dpSettings.MapItEnabled = "Y";
 dpSettings.MapItLabel = "Map it"; 
dpSettings.FilterNeed = "Y"; 
dpSettings.FilterRowSize = "5";
/* End of DataPage Settings Section */
/* Begin of DataPage Icon Condition Section */
/* End of DataPage Icon Condition Section */
mapEnvironment.AddDataPageMapSettings(dpSettings);
/*** End of DATAPAGE SETTINGS ***/ 
</script>