The Combined Chart and Report DataPage wizard functions by combining the individual wizards for charts and reports into one streamlined process.
- On Caspio homepage, select and open an app. In the App Overview page, click DataPages on the sidebar menu and click New DataPage.
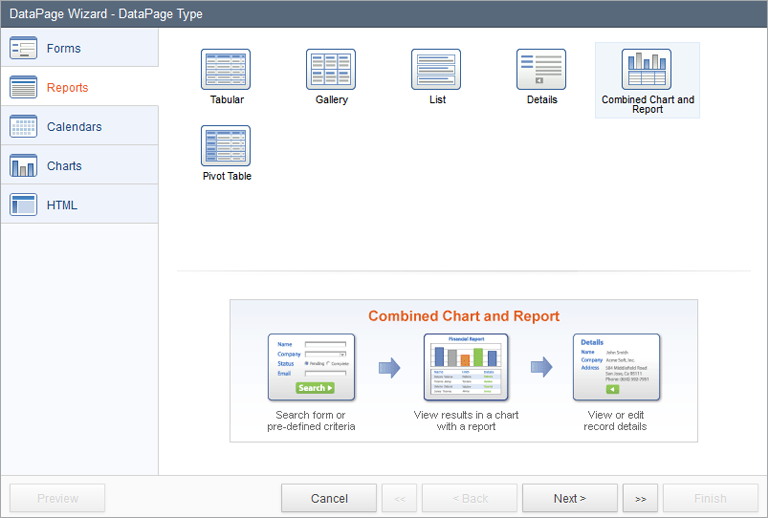
- On the DataPage Type screen, select Reports on the left menu and choose Combined Chart and Report.
- Next, on the DataPage Data Source screen, select the Table or View to use as the source for both your Report and Chart. In addition, you can configure the following:
- Name your DataPage or use the suggested name.
- Style determines the look and feel for your DataPage. Select a Style or use the default.
- Localization determines DataPage time zone, formatting for number, currency and date, and language of DataPage messages.
- Restrict access to this DataPage based on an Authentication or Connection. Without this option, the DataPage will be accessible without any restriction.
- Authentication: Users will be required to sign in prior to accessing your DataPage and the list of authorized users must be in a table in your account. Learn more about Authentications.
- Connection: Public users will be able to access your DataPage using their own social profile account (Google, Twitter, etc.). This is not a security feature. Learn more about Connections.
- On the Search Type screen, you can choose whether or not you would like to provide a search screen on this DataPage.
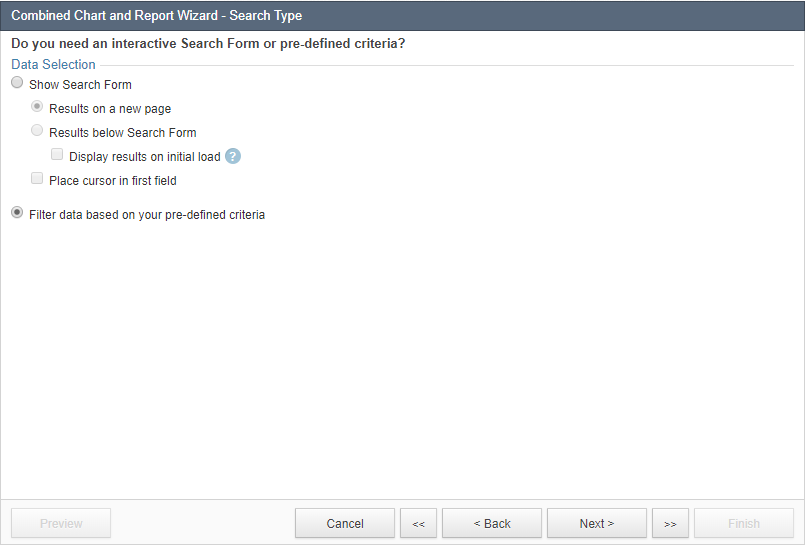
- Show Search Form – this option lets you create a search form so your users can perform ad-hoc search and query the database by entering in their own search criteria. Results can be displayed on a new page or together with the search form on the same page. The Display results on initial load option makes it possible to automatically display default-criteria results before users perform a search.
- Filter data based on your pre-defined criteria – this option is for creating a pre-defined report where the criteria is defined by you. It lets you configure a hidden filter to only display certain records (such as only records with “status=Active”). You can also use parameters to make the criteria dynamic.
- Record Level Security – this option is a restriction that is available for Authenticated or Connected DataPages and can be used to limit users’ access to records authorized to them.
- On the Select Search Fields screen, choose the fields for your search form. To select fields, move the fields from the Available Fields list to the Selected Fields list.
- On the Configure Search Fields screen, you can format each individual field by selecting a form element, selecting one of the Comparison Types, and configuring the field options as needed. Alternatively, if you set the search with a pre-defined filter on the Search Type screen, you select the fields to be included. Then select the Comparison Type and the Value. You can also select no filtering fields if you wish to display all records in the table.
Note: Some Unicode characters such as emoji are ignored in the search criteria.
- On the Select Results Page Fields screen, you can pick the fields that will be included in the results page by moving these fields from the Available Fields list to the Selected Fields list.
- On the Results Page Editing Options screen, you can enable editing data in the results page. See Interactive Reporting Options for further details.
- On the Configure Results Page Fields screen, each field can now be configured. Enter a column header label in the Label field, and depending on the type of data stored in the field you can render the value as Text, HTML, or an Email/URL links. Text values can be displayed in a variety of formats. You can also use the Insert button to add other elements such as a header and footer, and HTML blocks. Calculated fields can also be added and later used in the Chart.
- The Search Results Options screen allows you to configure the default sorting of results records, interactive sorting, link to the search form, etc. See Interactive Reporting Options for further details.
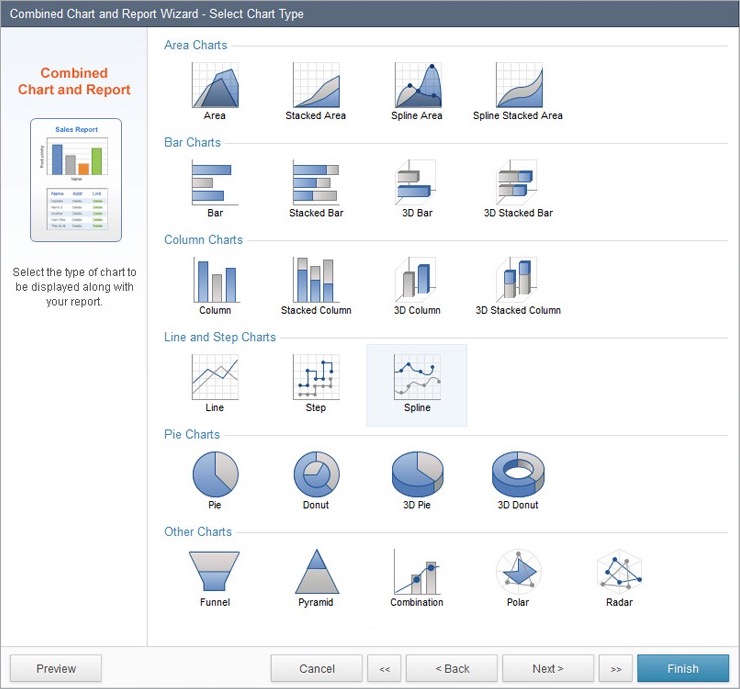
- At this point your Report is complete. The next step is to create a Chart component that will graph the data from your Report results. Select the desired chart type on this screen.
- On Configure Chart Options screen, you will configure all of your chart parameters. This screen is exactly the same as creating a regular Chart DataPage, however, in combined Report and Chart DataPages you can also use the data generated in Calculated Fields as the value field of your Series.
- On Chart Results Options screen, you can configure results sorting and number of displayed records. You can also choose between charting all results or only the data shown on the page. Chart position can be above or below the results table.
- Finally, you can also add a drill down Details page to the individual results that appear in your report. This Details page is configured just as you would in a non-combined Report.